| Table of Contents |
|---|
...
Description of the satellite data regions:
satellite data region | historical data start | description of satellites | when the local DAY-1 is available | real-time and nowcasting availability |
GOES WEST | 1999-01-01 | 2019+: GOES-S, 10-minute time step 2018 - 1999: GOES-W, 30-minute time step | 09:00 UTC | Satellite data availability delay is 2-12 minutes and it increases from south to north. Processing frequency is every 10 minutes and it takes another 5-15 minutes. |
GOES EAST | 1999-01-01 | 2019+: GOES-R, 10-minute time step 2018+: GOES-R, 15-minute time step 2017 - 1999: GOES-E, 30-minute time step | 05:00 UTC | same as the GOES WEST region |
GOES EAST PATAGONIA | 2018-01-01 | 2019+: GOES-R, 10-minute time step 2018+: GOES-R, 15-minute time step | 05:00 UTC | same as the GOES WEST region |
METEOSAT PRIME SCANDINAVIA between 60°and 65° latitude | 2005-01-01 | 2005+: MSG 15-minute time step | 00:30 UTC | not yet |
METEOSAT PRIME | 1994-01-01 | 2005+: MSG 15-minute time step 2004 - 1994: MFG, 30-minute time step | 00:30 UTC | Satellite data availability delay is 2-16 minutes and it increases from north to south. Processing frequency is every 15 minutes and it takes another 5-15 minutes. |
METEOSAT IODC | 1999-01-01 | 2017+: MSG 15-minute time step 2016 - 1999: MFG, 30-minute time step | 22:30 UTC | same as the METEOSAT PRIME region |
IODC-HIMAWARI | 1999-01-01 | 2017+: HIMAWARI 10-minute time step 2016 - 1999: MFG, 30-minute time step | 16:00 UTC | same as the HIMAWARI region |
HIMAWARI | 2006-07-01 | 2016+: HIMAWARI 10-minute time step 2015 - 2006: MTSAT, 30-minute time step | 16:00 UTC | Satellite data availability delay is 5-15 minutes and it increases from south to north. Processing frequency is every 10 minutes and it takes another 5-15 minutes. |
| Info |
|---|
Each daily update of the satellite data re-calculates irradiance values for two days backwards (DAY-1 and DAY-2). Monthly update (on the 3rd day of each calendar month) re-calculates values of the whole previous month. The purpose of these updates is described in this article. We gradually expand spatial coverage of the satellite data accessible via the API. To request operational and historical data in the out-of-coverage areas, please use Solargis climData online shop or contact us. The data from covered regions in the map is also available in the interactive application pvSpot (daily operational data) and the data is accessible within minutes after purchasing in the climData online shop. |
...
Solar data parameters (GHI, DNI) taken from the NWP models are used to fill the period from the current day onwards. NWP data are not used for historical solar data records (see the satellite data section). For meteorological data parameters (TEMP, WS, WD, PREC, RH, PWAT, ...) NWP data sources are used in the whole range. Historical meteorological data older than MONTH-1 can be considered as definitive. Solargis uses post-processed NWP historical data products from the following providers: NOAA (GFS, CFS v2), ECMWF (IFS, ERA5), DWD (ICON). The NWP data coverage is global - between latitudes -60 deg (South) and 70 deg (North).
...
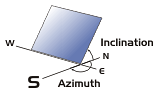
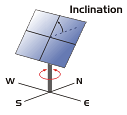
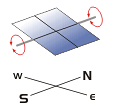
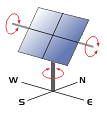
GeometryFixedOneAngle | GeometryOneAxisVertical | GeometryOneAxisInclinedNS | GeometryOneAxisHorizontalNS | GeometryTwoAxisAstronomical |
|---|---|---|---|---|
  |  |   |   |  |
|
|
|
|
|
...
element name | topology |
|---|---|
defined in | |
description | The element is for defining PV plant layout on the ground. The reason is to provide inputs for calculation of self-shading impact on PV power (e.g., how close to each other are PV constructions). |
content | none |
@type* | XML element type, required, concrete type of how topology should be modeled. Use one from TopologyRow (applies for the 'GeometryFixedOneAngle' geometry), TopologyColumn (use for all trackers). It is assumed trackers are spaced equally in both directions (rows and columns) creating a regular grid. |
@relativeSpacing | required, unitless ratio. The attribute specifies the ratio of distance between the neighboring PV table legs and PV table width. Direction of the distance depends on whether topology is specified as TopologyRow or TopologyColumn. See picture below how to calculate the value. |
@type | optional. This parameter estimates a magnitude of loss of PV power when modules are shaded or semi-shaded. The effect depends on wiring interconnections within a module. Shading influence ranges from 0% (no influence) to 100% (full influence) and it is classified into following categories (based on the influence value): PROPORTIONAL = 20% (for a-Si, CdTe and CIS where the loss of generated electricity is proportional to the size of module area in shade) When this attribute is missing, the self-shading influence is estimated to 5%. |
Calculation of the relative row spacing value (= x3/x2):
...
| Note |
|---|
Timestamps used in the XML response comply with the ISO 8601 standard for date and time representation https://en.wikipedia.org/wiki/ISO_8601. Time stamps are also aware of time zone (offset from UTC). Time zone designators are appended after the the time part of timestamp string. If the time is in UTC (https://en.wikipedia.org/wiki/Coordinated_Universal_Time), Z is added directly after the time without a space. Z is the zone designator for the zero UTC offset e.g., 2017-09-22T01:00:00.000Z . If there is an offset from UTC, this is designated by appending +/-HH:MM after the timestamp string, e.g., 2017-09-22T01:00:00.000-05:00 (UTC-5). |
...